Challenges for the Tooling Industry will Impact Processors
by Laurie Harbour
Harbour Results, Inc.

Chart A: HRI's analysis of the estimated size of the North American automotive tooling industry in 2012 is $9.25 billion. This number represents tooling purchases for North American vehicle programs only.
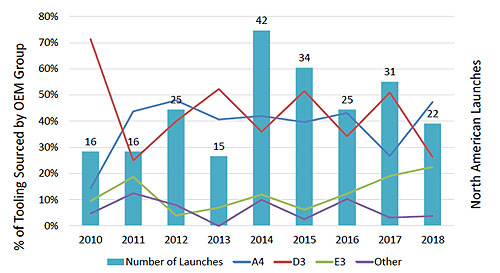
Chart B: HRI sees substantial growth, particularly for European OEMs that are relatively new to this country.
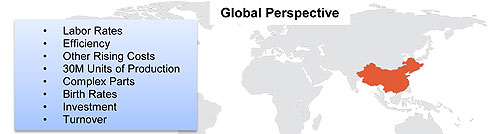
Chart C: HRI believes that there are several factors that will make LCCs, and China in particular, less of an option to meet the growing tooling demand in North America and around the globe.
In October of 2013, Harbour Results, Inc. (HRI) and the Original Equipment Suppliers Association (OESA) collaborated on a study of automotive tooling. The initial goal for this benchmarking study was to analyze payment terms and sourcing practices within the industry, which are two very hot topics for tool suppliers. However, the study focus evolved into an analysis of the entire tooling value stream and was designed to provide insight into and understanding of the roles of each stakeholder: OEMs; Tier 1 and Tier 2 parts suppliers; and tool suppliers. The study's objectives were to uncover the root cause of inefficiencies, waste and risks impacting the supply chain; identify best practices; and provide cost-saving opportunities to the entire industry.
Nearly a year was spent on research for this study, and it included formal interviews with seven OEMs (data gathered from three additional OEMs was informal), nearly 50 Tier 1 and Tier 2 suppliers, more than 50 tooling suppliers and various industry experts. In addition to these interviews, OESA conducted a survey of part suppliers and tool suppliers. This survey was executed with support from other associations as well, including the Manufacturers Association for Plastics Processors (MAPP). The data was used both to supplement interview data and validate key findings. The final report totals nearly 500 pages of detailed analysis on the tooling industry with a 43-page Executive Summary.
The Harbour team uncovered some very interesting facts that affect not only automotive suppliers purchasing tools, but also manufacturing suppliers in other industries that are purchasing dies and molds for their businesses. Given Harbour's extensive work in plastics processing, we wanted to look more closely at this data and the effects on processors as they acquire molds in future years. The following are some of the key facts from the study.
Size of the market
The HRI team spent many months gathering data on the number of tool shops in North America. Using several lists and recent visits to more than 120 shops in Canada and the US, HRI determined that the focus was to be on tool suppliers primarily supporting the automotive industry and with the size and capability to grow. Although focused on automotive tool suppliers, the research led HRI to study the entire industry. According to the Bureau of Labor Statistics, there are more than 5,000 shops in the US; however, this includes every small shop under $1 million in revenue that makes small details, heat treat, graining and parts for tooling. These shops do not have the strength and capability to grow with the automotive demand coming in the future. Therefore, these shops were excluded from the analysis, and focus was placed solely on mid-sized to large shops. Following are the key figures from the research on the size of the tooling industry:
HRI estimates there are 625 US tool suppliers and 125 Canadian shops focused primarily on the automotive industry. Many of them build tools for other industries, such as appliance and recreation, but these shops have a majority of their business in automotive – they make 80 percent of the primary critical tools in a vehicle.
The average size of the North American tooling supplier is between $15 and $18 million. Many in the industry believe there are a high number of large tool suppliers that are $50 million and above, but in fact there are only a handful of these large tooling suppliers (approximately 15 to 20).
This focused group of tool shops directly employs approximately 75,000 people (an average of 100 people per $15 million shop) and a total of 187,500 workers when the support shops are included.
Utilizing the 750 suppliers in North America and the average size of a shop, the industry capacity for the US and Canada is approximately $11.25 billion. Looking at data on exports from LCC (low-cost country) regions, there are few shops out of thousands that support the majority of exports to North America for automotive. Based on estimates, HRI believes there is approximately $0.5 to $1.5 billion in imports from LCC adding to the capacity. Not included in this number is the amount of tooling coming into North America from Europe, Japan and other non-LCC countries to support foreign OEMs with their production. This information is too difficult to gather and not available from the OEMs.
The average number of major tools per vehicle is between 2,000 and 3,000, depending on complexity of the vehicle. However, the total number of tools per vehicle, including powertrain, is closer to 7,000. Tools range in cost from $5,000 to $1 million. For example, a front fascia tool can range from $500,000 to $1 million for the injection mold alone. In addition, each assembly may require more than 35 tools to complete.
HRI estimates from interviews that the OEMs in North America spend approximately $9.25 billion on vendor tooling, on average for vehicles produced in North America. At 2012 vehicle volume levels, the average North American vendor tooling content per vehicle was $550.
These facts about the industry are critical to understand before moving forward with the other findings of the study. The OEMs spend billions of dollars on vendor tooling for their vehicles, and their current battle is the ever-changing consumer. Growing product complexity and mass customization are all forcing more tools per vehicle (20 percent more than 10 years ago per vehicle), and costs are rising. This same phenomenon is happening in every industry of manufacturing. Whether it is appliances, medical equipment or devices, consumer goods or industrial products, the changing consumer wants to mass customize the product and have more features. Every industry is struggling with rising costs and the need for more capacity while trying to meet these consumer demands. What is the future demand for tooling in the automotive industry?
Tooling growth results in capacity issue
It became critical to HRI to define the size of the vendor tooling industry in North America for today and forecast where it would be in five years. Chart A reflects HRI's analysis of the estimated size of the North American automotive tooling industry in 2012 to be $9.25 billion. This number represents tooling purchases for North American vehicle programs only.
Based upon discussions with individual tool shops and proprietary capacity surveys done on the industry, HRI then defined the actual capacity in the market for tools in North America to be approximately $11.25 billion, or a 79 percent utilization rate. Utilizing many sources of data, HRI is forecasting a growth in total OEM tool spend to $15.20 billion by 2018, or a 64 percent increase over the current spend.
HRI's 2018 forecast uses 2012 as a baseline for complexity and tooling cost per launch. The 2018 forecasted value is based on the number of vehicle launches planned in North America for that year (source: LMC Automotive).
Chart B further validates the growth of tooling by analyzing the foreign OEMs' growth in North America. This utilizes the number of launches each year (source: LMC Automotive) and plots the percentage of tooling available for sourcing by OEMs. Using each company's number of launches and the data shared with HRI on the planned percentage of tooling sourced locally, HRI estimated this growth through 2018. The chart shows the substantial growth, particularly for European OEMs that are relatively new to this country.
The bottom line to the study research shows a $6 billion capacity gap by 2018. Further, HRI believe that this number is conservative and could be higher if current demand for new vehicles continues.
As a result of this growth, the main question to be answered is where will this additional capacity come from? Some believe the simple answer is increased sourcing to LCCs. However, in looking at China where a support infrastructure is in place, there are several evolving indicators that lead to a conclusion that this is not a viable option. HRI has spent a great deal of time in the past three years in Chinese tool suppliers (almost 60 facilities). Additionally, we have studied the economic data in this region. As Chart C indicates, HRI believes that there are several factors that will make LCCs, and China in particular, less of an option to meet this growing tooling demand in North America and around the globe.
All in all, the factors working against China seem to be higher than those in favor of moving production or tool manufacturing to the China market. Is Europe a region that could fill the capacity gap for tooling? The short answer is no. In fact, part of the growth in North America is due to the European companies moving their tool sourcing to the region in which they are building vehicles. Many European companies have said that North America is becoming a low-cost country to them, and they are asking their German tool suppliers to set up shop in North America as a potential solution to the growing problem. There really are no other regions of the world that could help close the capacity gap for vendor tooling because the infrastructure is just not there.
What does it mean to the plastics industry?
Although much of the research and discussion has been driven specifically to the automotive industry and its tool suppliers, the message is a significant one to those processors that are buying tooling to support other industries as well. The auto industry tends to be a microcosm of a larger issue; in this case, it's further tightening of pricing, tied to a capacity shortage of tool suppliers. Recently, Harbour spoke to a group of smaller mold builders that were not necessarily tied to the automotive industry. They indicated to Harbour that they have plenty of capacity and are ready to be the solution to the industry's issues. However, a survey of their customers shows that those tool suppliers are not price competitive in today's market, particularly when competing with China and even while prices are rising.
The business owners and leaders running plastics processing businesses today need to share more information and data with their local tool suppliers and get them engaged with associations like the American Mold Builders Association (AMBA) and Manufacturing Association of Plastics Processors (MAPP) in order to support them in their efforts to improve their competitiveness. Too often, processors do not provide the necessary feedback to tool suppliers that is needed to convince them they need to work harder at improving their businesses.
Takeaways for plastics processors
Processors need to be cautious in how they leverage current tool suppliers against suppliers in China. HRI has seen many North American tool suppliers let their customers send tooling to China, oftentimes hoping lessons will be learned. This has left some processors in a difficult situation.
It is critical for processors to work harder to develop relationships with their tool suppliers. With capacity constraints throughout the tooling industry in North America, many suppliers are stepping forward to grow their businesses and capture market share in new industries. If relationships are not solid, those suppliers may find new and better customers, and processors may find themselves struggling to locate available capacity.
Processors need to be more diligent about assessing their tool suppliers. It is customary to assess component suppliers, but infrequently do tool shops get assessed and/or audited by their customers. Processors should use these audits to assist the tool supplier in providing better service and product to the processors' businesses.
Tool suppliers have become quoting factories, driving tremendous transactional waste. Processors can do their part by not contributing to this quoting machine. Respect the tooling suppliers' time.
Plastics processors can drive improvement at the tool supplier if they become an "easy" team to work with. "Easy" does not mean that the processor pays more, but it does mean that the processor is easy to communicate with and to work with. Collaborate with tool suppliers and greater efficiency will be returned.
The easiest way to gain efficiency at a tool supplier is by having visibility into the business load and schedule for an extended period of time. If processors can collaborate and share their strategic plans with their tool suppliers, the tool suppliers will better be able to plan and manage their workflows.
The processors that have had the most successes have forged high-level relationships with their tool suppliers. They have become clientele' to a handful of shops and consistently outsource their needs to that shop. As a result, they are getting more value from that shop.
Some processors have considered bringing tool building in-house, but they have struggled to find talent. In the end, most have chosen not to expend resources into tool building, because they realize it is not their core competency. This is why collaboration is so critical.
It also is critical to only refer tool suppliers selectively; only the closest strategic partners should have access to a processor's best shops. This is difficult, particularly when in an association with other great processors, but the best resources must be protected.
Tool suppliers from some LCCs will fill the capacity gap identified in the North American automotive industry and other industries because manufacturers will not stop launching new products. It is critical for processors and tool suppliers to work together to capitalize on this opportunity. Why not have North America reclaim this effort by supporting North American plastics business growth?